View3D
View3D allows visualizing data in 3D space. 3D model can be zoomed, rotated and lit up with various ways. Different series types can be placed into the same 3D view to make a combined visualization.
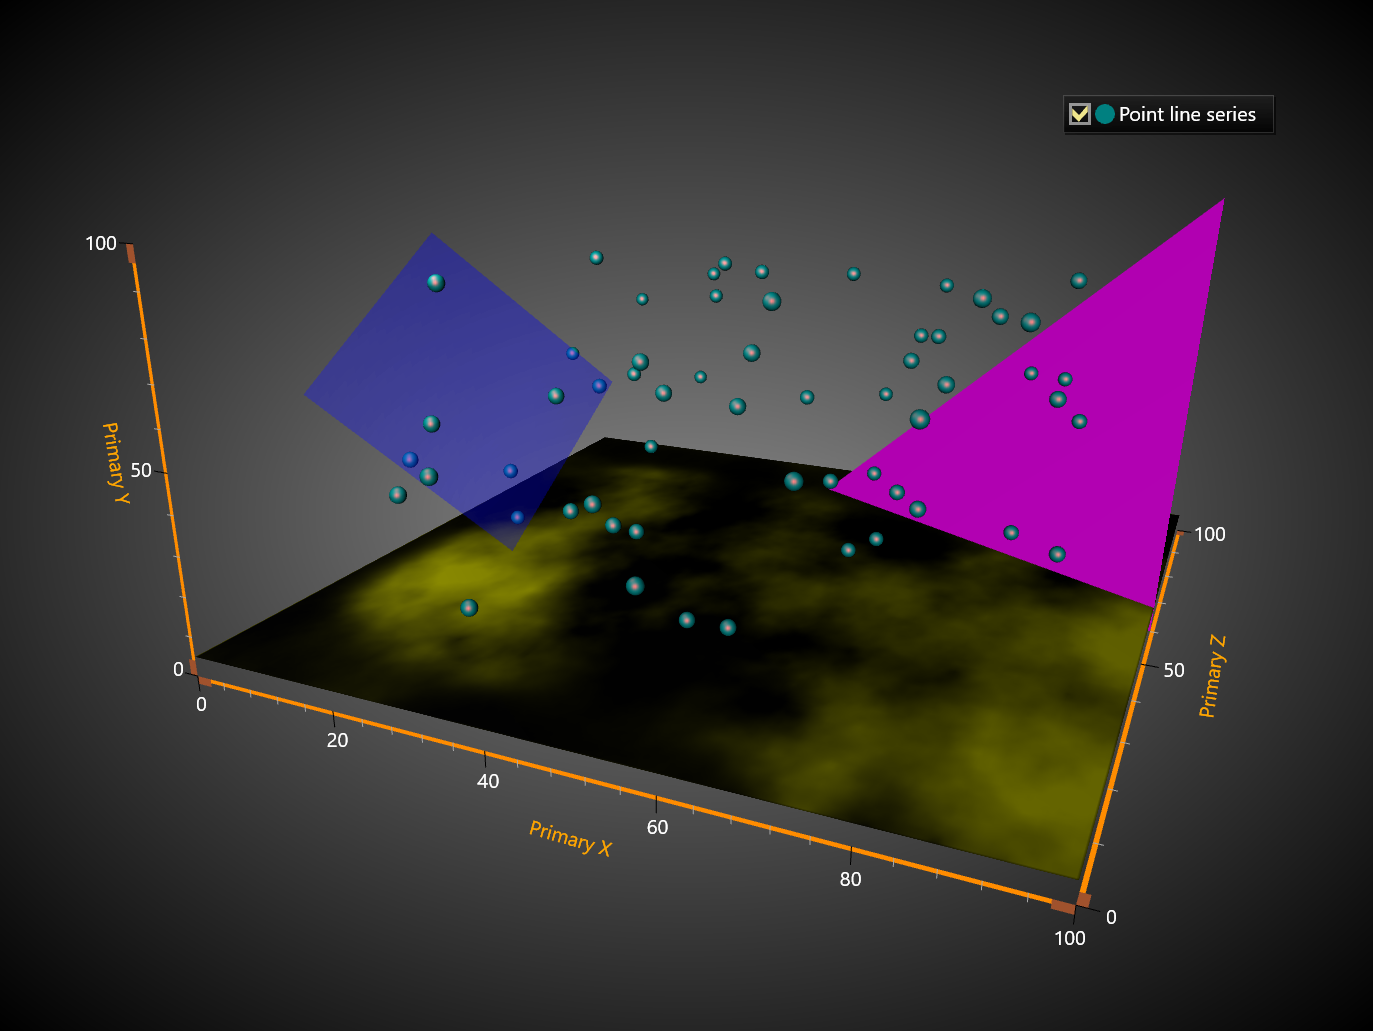
PointLineSeries3D
PointLineSeries3D allows presenting points and line in 3D space. For points, there are many basic 3D shapes available. Points are connected together with a line, if LineVisible property is set true.
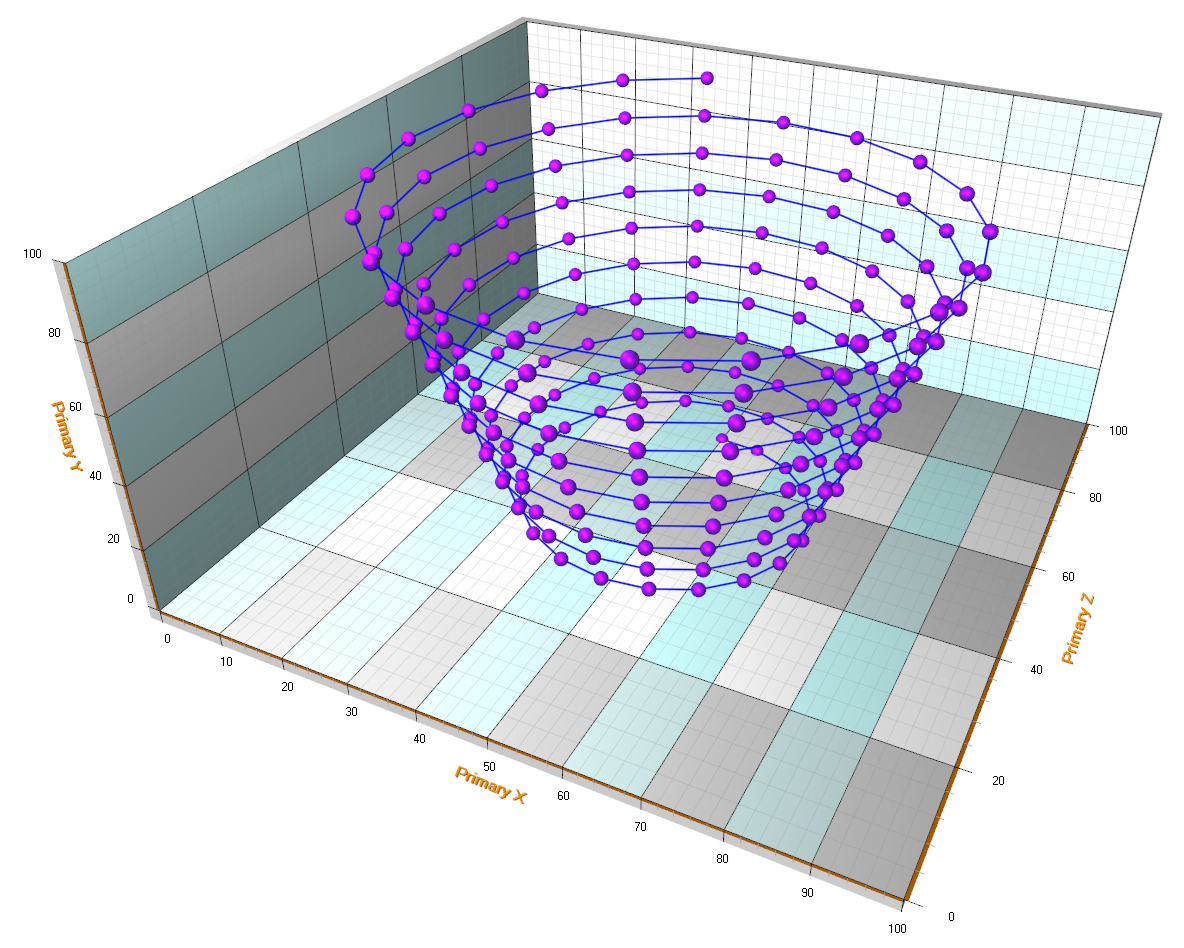
PointLineSeries3D supports three different point formats:
- Points property (SeriesPoint3D array)
- PointsCompact property (SeriesPointCompact3D array)
- PointsCompactColored property (SeriesPointCompactColored3D array)
PointsCompact and PointsCompactColored structures are very memory efficient, allowing up to 100 million data points visualization with simple point styles. Set the point format via PointsType property.
More details about PointLineSeries3D could be found on this page.
SurfaceGridSeries3D
SurfaceGridSeries3D allows visualizing data as a 3D surface. In SurfaceGridSeries3D, nodes are equally spaced in X dimension, and in Z dimension as well.
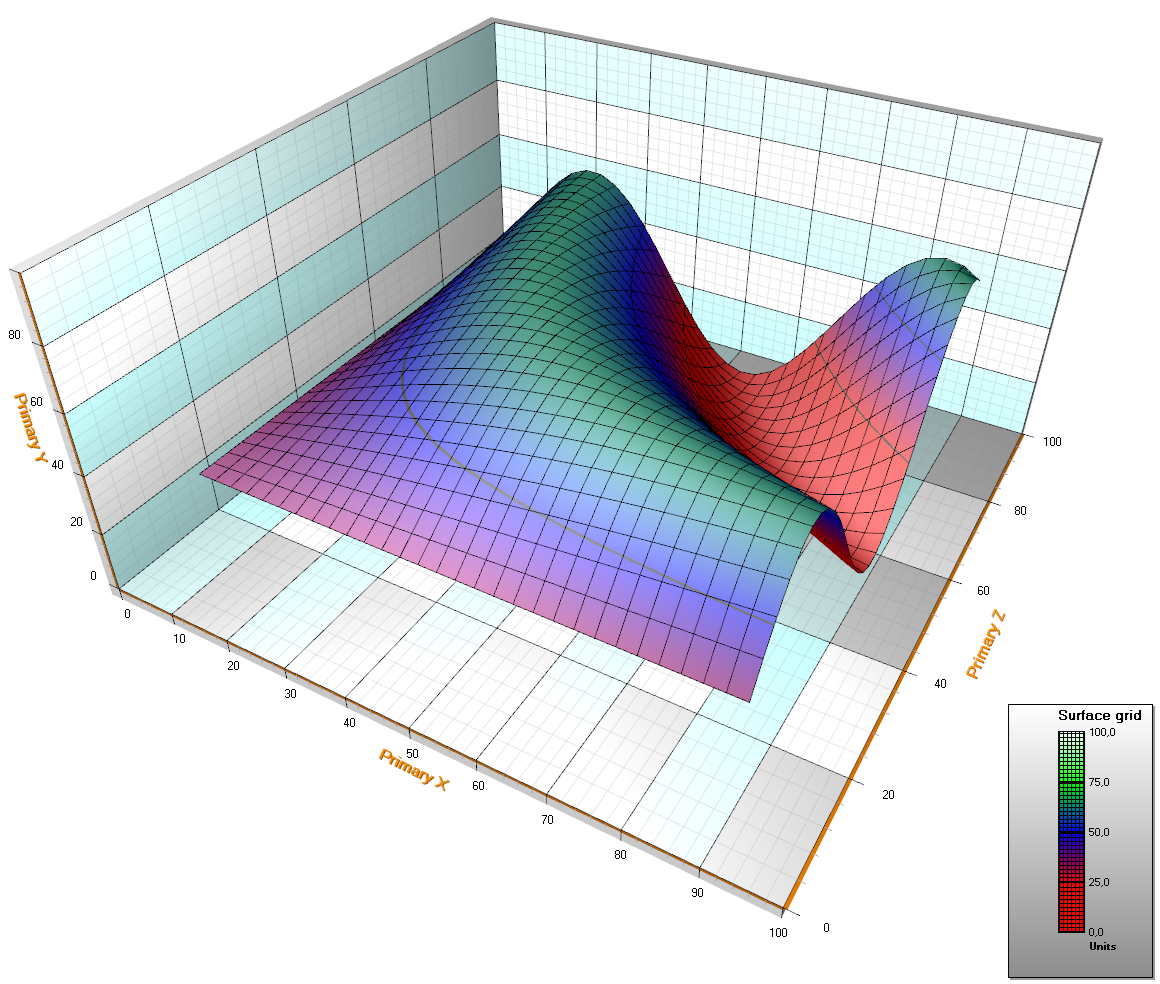

Surface grid nodes. SizeX = 5, SizeZ = 7.
More details about SurfaceGridSeries3D could be found on this page.
SurfaceMeshSeries3D
SurfaceMeshSeries3D is almost similar to SurfaceGridSeries3D as they both mostly have the same properties. The biggest difference is that surface nodes can be positioned freely in 3D space. In other words, the surface does not have to be rectangular. SurfaceMeshSeries3D allows warping the surface virtually to any shape, for example to a sphere or a human head.
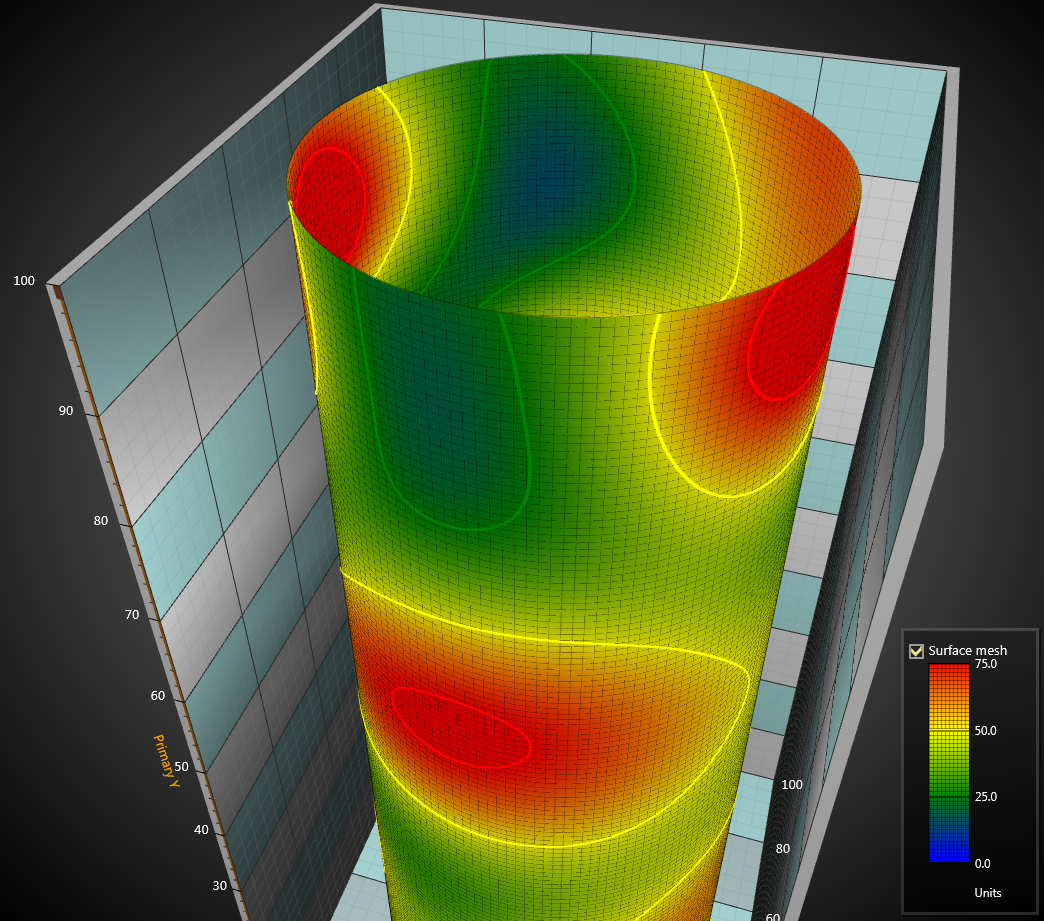

Surface grid nodes. SizeX = 4, SizeZ = 4.
More details about SurfaceMeshSeries3D could be found on this page.
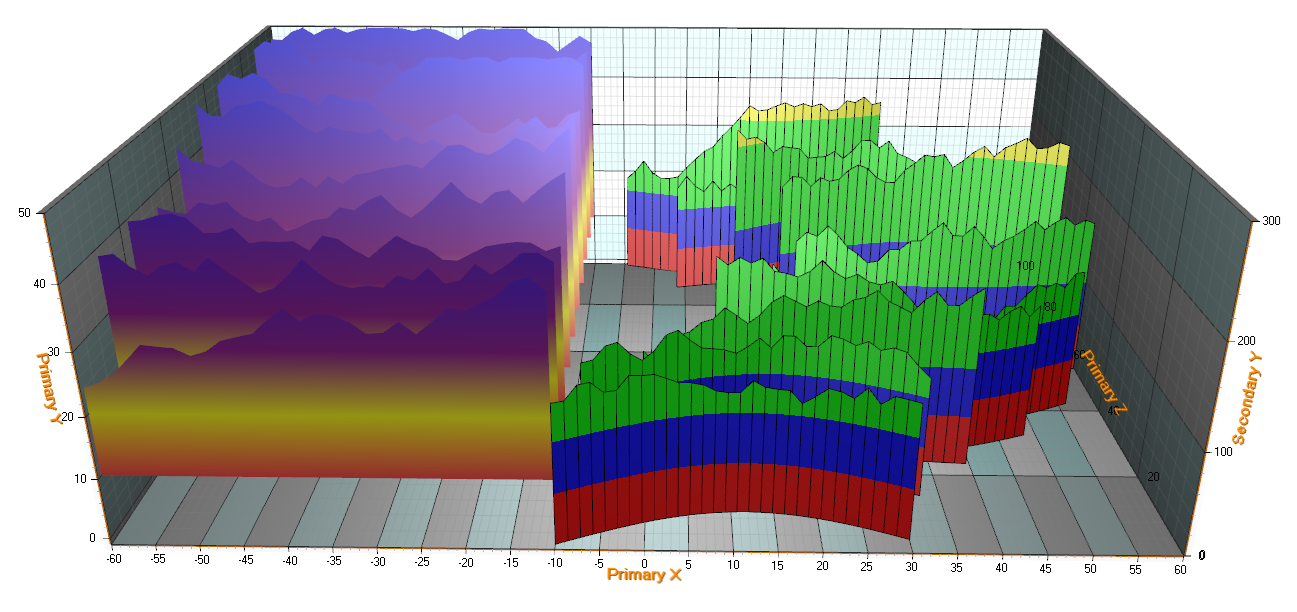
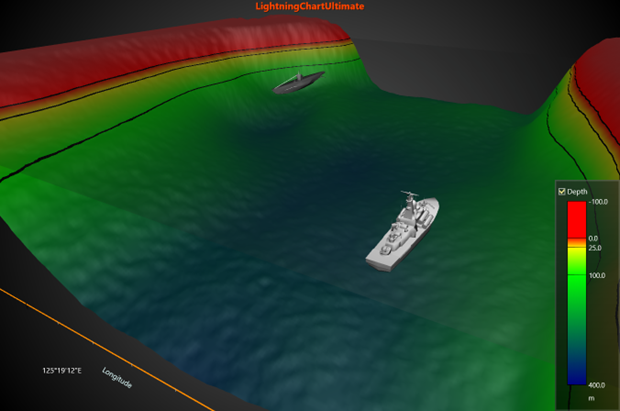
WaterfallSeries3D
With WaterfallSeries3D, the data is visualized in area strips. Areas can be filled, wire-framed and contour-lined like SurfaceGridSeries3D. In Y-dimension, area starts from BaseLevel property value. The node data can be set like in SurfaceMeshSeries3D. WaterfallSeries3D is especially handy for presenting traditional 3D spectrum.
More details about WaterfallSeries3D could be found on this page.
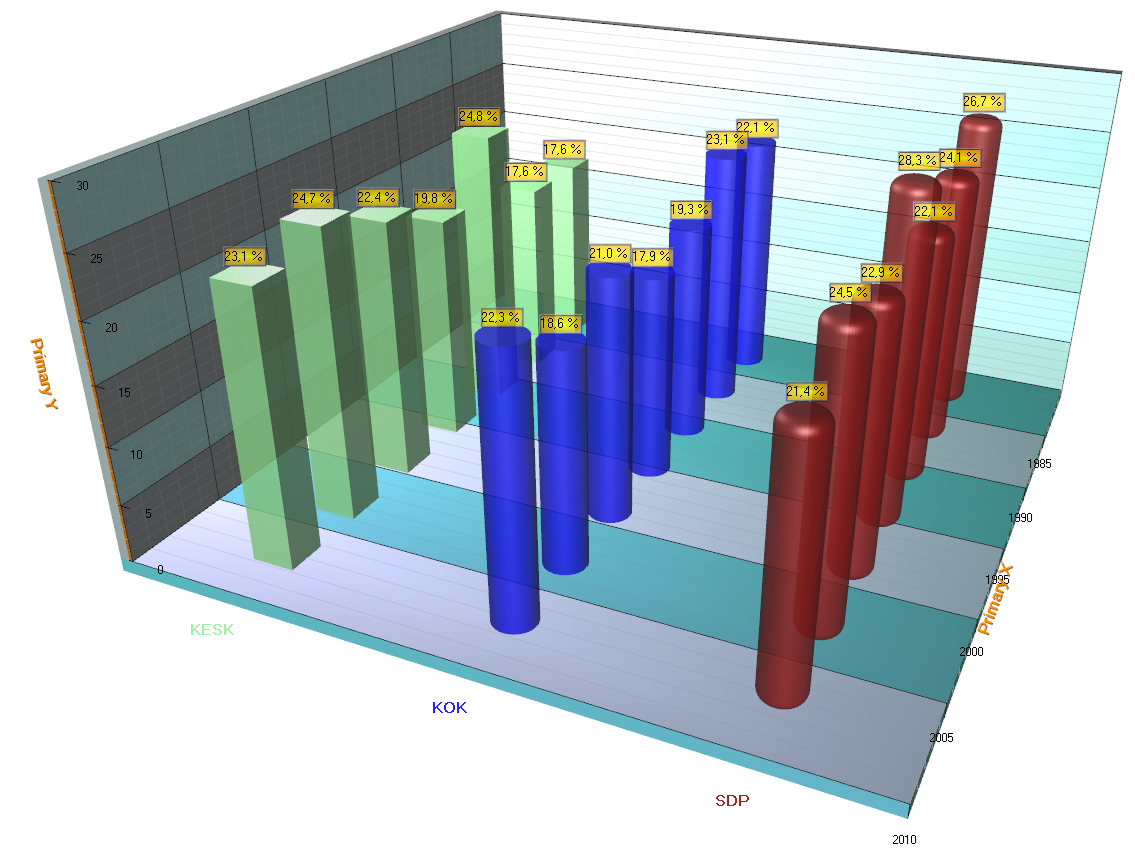
BarSeries3D
BarSeries3D allows bar data visualization in 3D. Bar series can be grouped with many options available in BarViewOptions property of View3D. BarViewOptions.ViewGrouping controls how the bars are grouped in the 3D view. Bars are drawn in Y axis direction. To show the bars vertically, rotate the camera 90 degrees.
More details about BarSeries3D could be found on this page.
MeshModels
MeshModels list property allows inserting 3D models from external 3D model editors into LightningChart View3D. The models can be imported in OBJ format, which is a generic format in 3D modeling applications and game engines.
A MeshModel object Position follows the X, Y and Z axes it has been assigned to. The model can be rotated by editing Rotation property. Size can be defined with Size property, which is a collection of factors for original model size and does not follow axis ranges or 3D world dimensions.
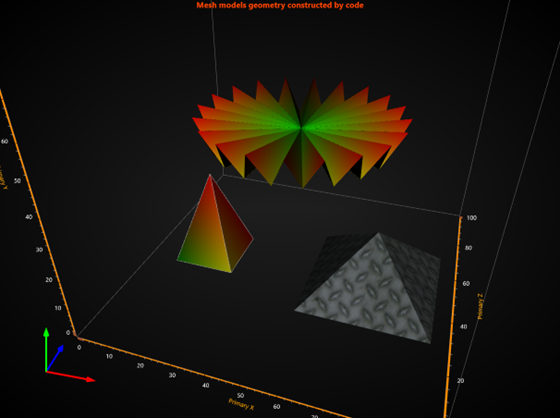
Starting from v.8.2, MeshModel supports constructing the MeshModel geometry programmatically. It allows visualizing objects and shapes that have been produced via computation. The following Create methods are available:
- Create(positions, colors, indices)
- Create(positions, colors, normals, indices)
- Create(positions, textureCoordinates, bitmap, textureWrapMode, indices)
- Create(positions, normals, textureCoordinates, bitmap, textureWrapMode, indices)
More details about MeshModel could be found on this page.
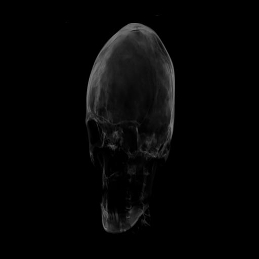
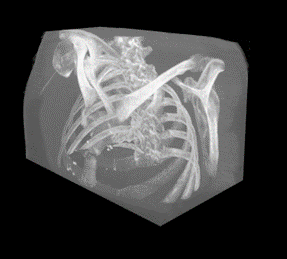
VolumeModels
VolumeModels is a tool for volume data visualization via Direct Volume Rendering. VolumeModel takes the volume data inside and visualizes it. LightningChart’s volume rendering engine is based on the Volume Ray Casting.
An image is produced by the algorithm via the volume data sampling along the tracks of the rays which travel inside the dataset. A simple realization of hardware acceleration for Volume Ray Casting requires generating boundaries for a volume object. Usually, they are represented by a cube. High rendering quality without artefact, and usage of the interchangeable ray function are the main advantages of this technology.
VolumeModels are available only when DirectX 11 renderer is used.
More details about VolumeModel could be found on this page.
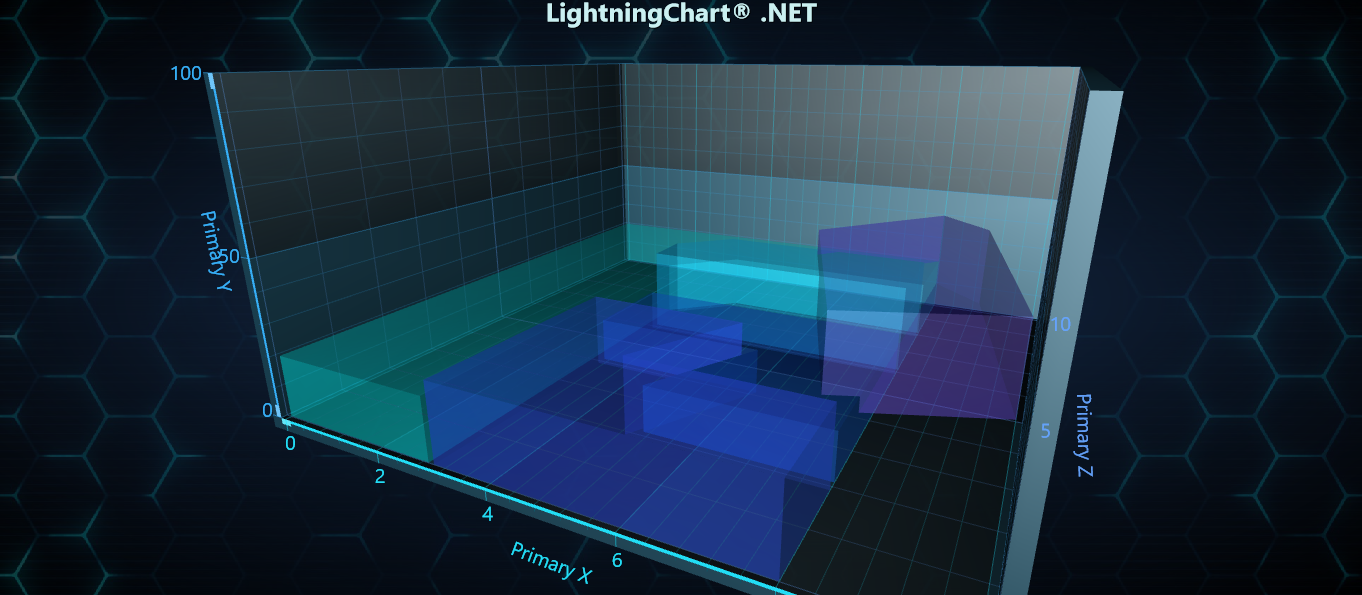
Rectangle3D
Rectangle3D allows presenting a rectangle, turned to any angle, at any size, at any location. They can be added to View3D.Rectangles list. Rectangles can also act as planes by defining their size according to View3D.Dimensions.
Set Size in 3D world dimensions (not X, Y or Z axis values) as Width and Height. Set the center point via Center property, defined in X, Y and Z axis values. Rotation property specifies the rotation in degrees.
Fill settings can be modified via Fill property. Solid color and bitmap fills are available. To use bitmap fill, set the bitmap in Image, and enable UseImage.
More details about Rectangle3D could be found on this page.
Polygon3D
Polygon3D objects allow presenting a 2D polygon stretched to given Y range. They can be added to View3D.Polygons list.
Define the polygon path in X and Z axis values and store it in Points array. Set the Y range with YMin and YMax values.
Material.Diffuse controls the main color of the rectangle. Rotate the polygon to another angle with Rotation.X, Rotation.Y and Rotation.Z in degrees.
More details about Polygon3D could be found on this page.